OLTP Dashboard
The following is a list of each repository dashboard metric with a description of it’s purpose, explanation of how data appears and actions you can take within the dashboard.
Purpose: View the total number of unique repository users who have made at least 1 query through the sidecar or who connected to a repository in the selected timeframe (last 7 days or last 24 hours).
When Data Appears: Run a query through the sidecar for a repository in the selected timeframe (last 7 days or last 24 hours). This does not include IdP users.
Actions: Click the ellipsis menu and select View repository users to navigate to the Repository tab of the Data Sources page in ALTR. Select the repository and click the Users tab to view repository users associated with a specific repository, register additional repository users or remove repository users that are no longer needed.
Purpose: View a total count of all policies (active and inactive) for all data sources created in ALTR. This includes Snowflake and Databricks policies.
When Data Appears: Create a policy in ALTR.
Actions: Click the ellipsis menu and select View policies to navigate to the Policy page in ALTR. Here you can view all policies, create new ones or delete policies that are no longer needed.
Purpose: View a total count of queries made through a sidecar in the selected timeframe (last 7 days or last 24 hours). The donut chart illustrates queries made by unique, active sources (either a hostname or an IP address). An active source is one from which at least 1 query was made in the selected timeframe (last 7 days or last 24 hours).
When Data Appears: Run a query through the sidecar for a repository in the selected timeframe (last 7 days or last 24 hours).
Actions:
- Click the ellipsis menu and select View query audit log to view the Query Log page in ALTR. Here you can view the full query audit log for sidecar, including details on the queries from at each source. View the query JSON to expose the hostname or the IP address in order to trace log details on a specific source.
- Hover over a slice of the donut chart to view the specific source and a count of queries made.
- Click into the chart to view specific OLTP repositories making queries from that source. Continue to drill down to see a list of repository users who made queries with a query count. Continue to drill down to see a list of IdP users who impersonated a specific repository user and a count of queries made.
- Scroll on each of these drill-down lists to view the full list of users.
Visuals:
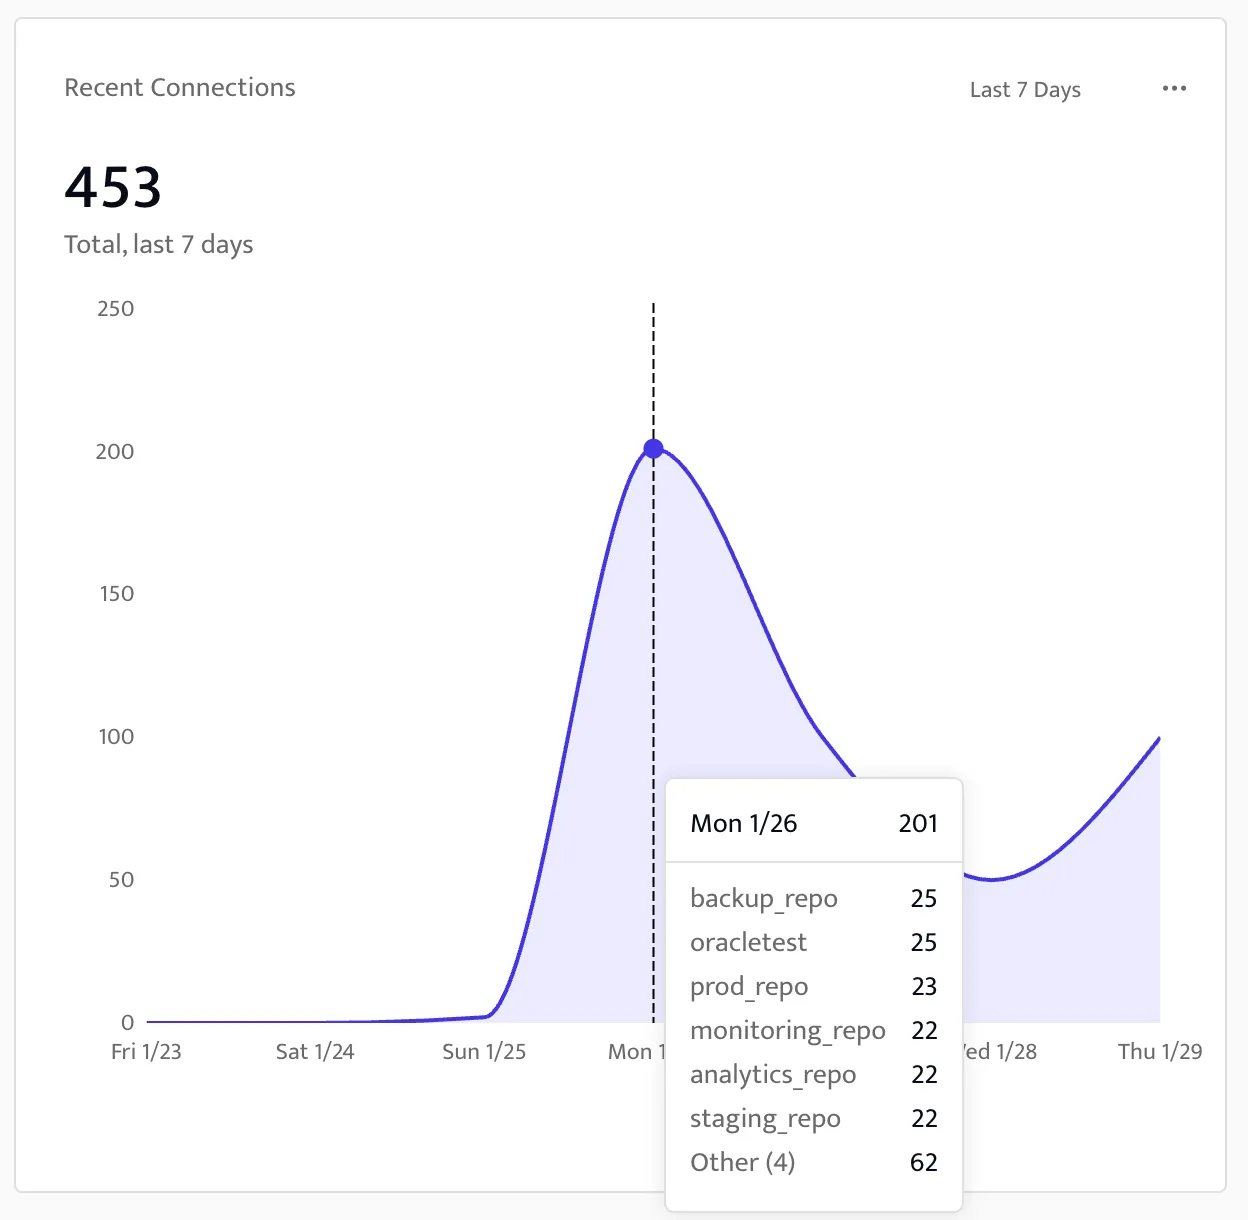
Purpose: View recent successful connections made to OLTP repositories.
When Data Appears: Make a connection to a repository through the sidecar.
Actions:
- Click the ellipsis menu and select View query audit log to view the Query Log page in ALTR. Here you can view the full query audit log for sidecars, including connection details, the affected repository and IdP users.
- Hover over the graph to view a list of repositories that were successfully connected on a specific day with the count of queries made.
Visual:
Purpose: View failed connection attempts to OLTP repositories.
When Data Appears: Fail to connect to a repository though the sidecar.
Actions:
- Click the ellipsis menu and select View query audit log to view the Query Log page in ALTR. Here you can view the full query audit log for sidecars to review failed connect details in order to identify impacted IdP and repository users, and to investigate repeated failures.
- Hover over the graph to view a list of repositories that failed to connect on a specific day with the number of failed connection attempts.
- Click into the chart to view a list of repositories and the number of failed connection attempts on a specific day. Continue to drill down to see a list of repository users who attempted to make a connection to the repository with a count of connection attempts.
- Scroll on each of these drill-down lists to view the full list of repositories and repository users, respectively.
Visuals:
Purpose: View a total count of queries made though the sidecar in the selected timeframe (last 7 days or last 24 hours). The bar chart shows the number of queries against the day of the week, grouped by repository type.
When Data Appears: Run a query through the sidecar for a repository in the selected timeframe (last 7 days or last 24 hours).
Actions:
- Click the ellipsis menu and select View query audit log to view the Query Log page in ALTR. Here you can view the full query audit log for sidecars, which contains a list of who and when the data was queried as well as the details of the query.
- Hover over the chart to view a break down of each repository type on a particular day with a count of queries made.
- Click into the chart to view queries broken down by repository type with a count of queries made. Continue to click into the chart to view repository users who made queries on a specific repository with a count of queries made.
- Scroll on each of these drill-down lists to view the full list of repositories.
Visuals:
Purpose: View a cumulative total of all OLTP repositories currently registered in ALTR.
When Data Appears: Register a supported OLTP data source to ALTR.
Actions: Click the ellipsis menu and select View repositories to navigate to the Repositories page in ALTR. Here you can view details on your registered OLTP repositories, register additional ones or remove repositories from ALTR.
Purpose: View a cumulative total of rows viewed from queries executed through the sidecar across all OLTP repositories in the selected timeframe (last 7 days or last 24 hours).
When Data Appears: Run a SELECT query through the sidecar for a repository in the selected timeframe (last 7 days or last 24 hours).
Actions: Click the ellipsis menu and select View query audit log to view the Query Log page in ALTR. Here you can view the full query audit log for sidecars.
Purpose: View a cumulative total of all sidecars that are registered for OLTP access in ALTR.
When Data Appears: Register a sidecar in ALTR.
Actions: Click the ellipsis menu and select View sidecars to navigate to the Sidecars page in ALTR. Here you can view all sidecars, register additional ones or remove sidecars that are no longer needed.
Purpose: View a list of the top 100 largest SELECT queries made by the number of rows accessed in the selected timeframe (last 7 days or last 24 hours). This table is a condensed view of the query audit log for sidecars.
When Data Appears: Run a SELECT query through the sidecar for a repository in the selected timeframe (last 7 days or last 24 hours).
Actions:
- Click the ellipsis menu and select View query audit log to navigate to the Query Log page in ALTR. Here you can view the full query audit log for sidecars, not just the top 100, and view additional details that aren’t displayed from this dashboard.
- Click a row in the table to view additional properties, the full JSON log entry, a list of all tags, all columns, etc.
Visuals:
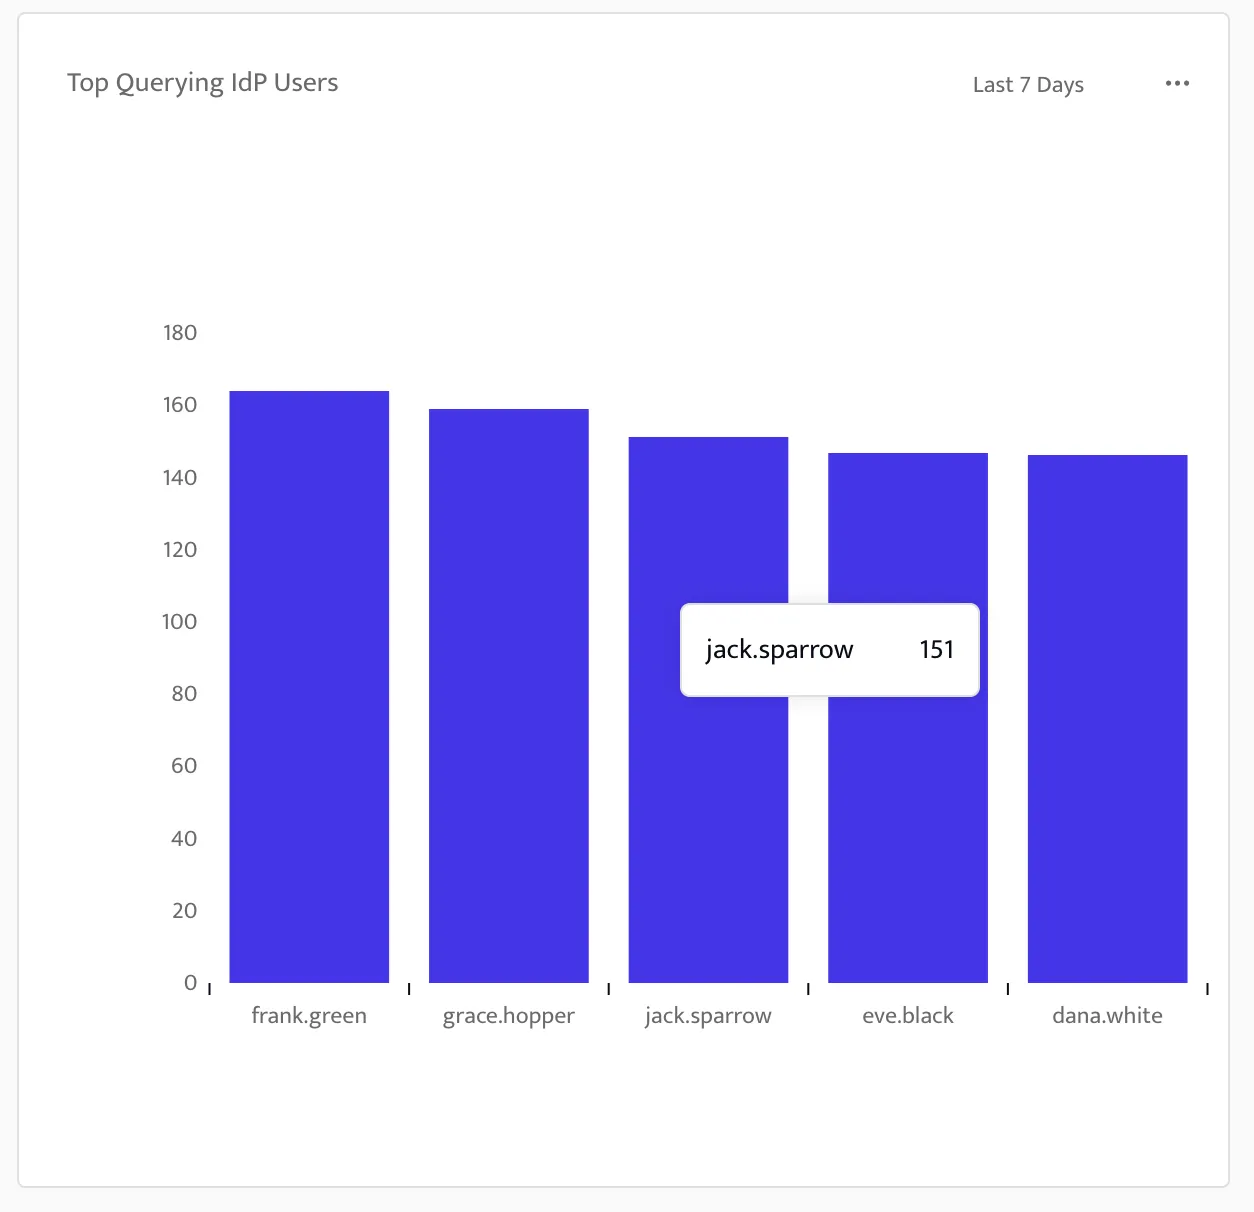
Purpose: View the top 5 Identity Provider (IdP) users (i.e., human users) who queried through the sidecar the most number of times in the selected timeframe (last 7 days or last 24 hours). The bar graph displays the number of queries against the name of the IdP user.
When Data Appears: Run a query through the sidecar for a repository using impersonation in the selected timeframe (last 7 days or last 24 hours).
Actions:
- Click the ellipsis menu and select View query audit log to view the Query Log page in ALTR. Here you can view the full query audit log for sidecars, including queries made by these top 5 IdP users.
- Hover over the graph to view the number of queries made by a specific IdP user.
Visual:
Purpose: View the top 5 repository users who queried the most number of times in the selected timeframe (last 7 days or last 24 hours). The bar graph displays the number of queries against the name of the repository user.
When Data Appears: Run a query through the ALTR sidecar for a repository in the selected timeframe (last 7 days or last 24 hours).
Actions:
- Click the ellipsis menu and select View query audit log to view the Query Log page in ALTR. Here you can view the full query audit log for sidecars, including the queries that these top 5 repository users made and the full list of all repository users who queried data.
- Hover over the graph to view the number of queries made by a specific repository user.
- Click into the graph to view the IdP users who impersonated a specific repository user with a number of queries made.
- Scroll on each of these drill-down lists to view the full list of users.
Visuals: